
Total Pageviews
Tuesday, April 12, 2011
Friday, April 1, 2011
Saturday, March 12, 2011
Saturday, February 26, 2011
Week 8 - Spatial Interpolation
Los Angeles County Rainfall calculation
The datasets available for rainfall for both current and average normal seasons in Los Angeles County Area are limited to 58 points, which have been manually entered and geographically located through X-Y coordinates definition and taken from the Los Angeles Water Resources Department under "Near real-time precipitation map" (complete list given below at bottom page).
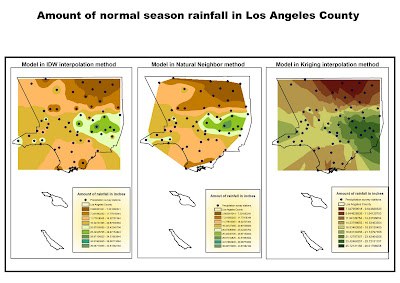
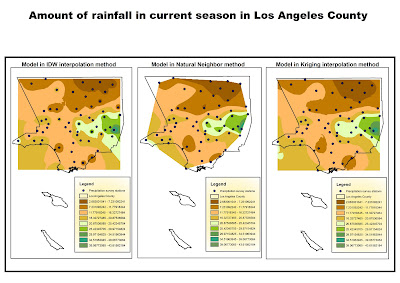
The following list of datasets includes three different methodologies of interpolation analysis, each with different characteristics and quality results, able to give a clear idea of trends and current situation of rainfall for this area. These methods are the IDW method, the Natural Neighbor method and the Kriging method.
No matters the method used for calculations, it is possible to see how the Eastern
area of the County, corresponding to the Los Angeles Padres Forest, has bigger amounts
of rainfall. This could be related with the fact that many of the stations in that area are located
at higher elevations, where altitude may have influenced amounts of rainfall and then
the amount of vegetation grown in that National Forest. On the other hand, desertic and internal areas have as expected the lesser amounts of rain. There is an augment in coastal areas where micro climates influence rainfall.
The Inverse distance method has as a result a map showing several "islands" of different values
within neighbor limits of those stations having higher values than the rest of the areas more conformal and balanced to the general trends. This can cause several cases of exceptions and gives more weight to the singular records, and so resulting in a map showing several exceptions and a general trend less conform.
The Natural Neighbor method is represented in map two. Here, the trends and the values look shared more equally within all the map, causing less prominence of singular differences compared with the previous map. I think it that in this case, given the fact that the distribution of rainfall within the territory has a simple spatial organization, this is the best of the three methods described for overall three analysis. The fact that one point is closer to a particular station has a strong relationship also in how close is the amount of rainfall to that same station.
Other factors calculated in weighed methods are less precise than this.
Kriging method shows in this case a precision that could be compared with the Natural Neighbor method, and creates Contour lines that are equally shared within the middle-points areas and finally very realistic.
Kriging analysis had furthermore smoothed and flattened these values, creating a map overall more flattened and with no peaks of value.
By comparing the second maps with the first ones, it is possible to see how rainfall during this current season has been lower than the average historic rainfall. It is possible to recognize also in this case regions where vegetation is more likely to grow and desert areas at North where rainfall is extremely low.
Also in this case, Natural Neighbor Interpolation method produced more equally shared distribution and contour lines of levels of rainfall rather than the Inverse Distance Weighted.
Natural Neighbor and IDW methods are methods showing a similar pattern, both indicating as there has been an increase in Western and Southern areas of the County, which correspond to the Los Angeles Padres Forest and the Coastal shoreline between Venice and Long Beach.
Not much has changed instead for the desert areas North of the County. Most of the County however had received much less amounts of rain than expected and probably is affecting reservoirs closer to most urbanized areas. These are in fact located at South-West, where most of the red areas created by the interpolation are located.
In this case, the flattening resulted with the Kraging interpolation method had shared the rainfall more equally within the southern areas and has given probably the most defined map of the differences between the two datasets as a result of the Interpolation.
NAME | ID Number | LAT | LONG | Elevation feet | Current S. | Normal S. | Difference S. | Elevation mts. | |
Acton Camp Precip | 58 | 34.450556 | -118.198333 | 2,625.00 | 6.65 | 10.03 | -3.38 | 800.10 | |
Agoura Precip | 56 | 34.135556 | -118.751944 | 800 | 13.7 | 17.84 | -4.14 | 243.84 | |
Aliso Canyon Precip | 57 | 34.328333 | -118.554722 | 2,367.00 | 20.16 | 22.82 | -2.66 | 721.46 | |
Aliso Canyon Wagon Wheel | 4 | 34.274722 | -118.526389 | 1112 | 17.13 | 19.57 | -2.44 | 338.94 | |
Avek Precip | 54 | 34.539167 | -117.923056 | 2,825.00 | 6.06 | 5.78 | 0.28 | 861.06 | |
Ballona Crk Precip | 55 | 33.998611 | -118.401389 | 38 | 8.94 | 12.39 | -3.45 | 11.58 | |
Bell Canyon (Rocketdyne) Precip | 52 | 34.178056 | -118.590833 | 2,260.00 | 14.02 | 14.74 | -0.72 | 688.85 | |
Bell Cyn Debris Basin Precip | 53 | 34.194167 | -118.656389 | 895 | 12.28 | 15.57 | -3.29 | 272.80 | |
Big Pines Recreation Park Pcp | 50 | 34.378889 | -117.688889 | 6,860.00 | 26.73 | 24.5 | 2.23 | 2,090.93 | |
Big Rock Mesa Precip | 51 | 34.039167 | -118.616667 | 300 | 19.65 | 16.58 | 3.07 | 91.44 | |
Big Tujunga-camp15 Precip | 46 | 34.289167 | -118.288056 | 1,525.00 | 13.74 | 19.36 | -5.62 | 464.82 | |
Bouquet Cyn @ Urban Precip | 47 | 34.448333 | -118.505833 | 1,300.00 | 9.88 | 7.98 | 1.9 | 396.24 | |
Brand Park Precip | 48 | 34.188056 | -118.271944 | 1,250.00 | 14.17 | 18.34 | -4.17 | 381.00 | |
Brown's Canyon Precip | 49 | 34.311667 | -118.607222 | 2,400.00 | 19.25 | 19.55 | -0.3 | 731.52 | |
Cedar Springs Precip | 42 | 34.355833 | -117.873333 | 6,780.00 | 30.16 | 29.95 | 0.21 | 2,066.54 | |
Chilao-St Hwy Precip | 43 | 34.317778 | -118.008056 | 5,275.00 | 20.75 | 22.9 | -2.15 | 1,607.82 | |
Clear Crk School Precip | 44 | 34.276944 | -118.17 | 3,150.00 | 27.52 | 30.54 | -3.02 | 960.12 | |
Cogswell Dam Precip | 45 | 34.243333 | -117.963333 | 2,300.00 | 25.47 | 34.21 | -8.74 | 701.04 | |
Domin Wat Co Precip | 39 | 33.831389 | -118.224722 | 30 | 13.9 | 12.11 | 1.79 | 9.14 | |
DP WHQ | 1 | 34.081667 | -118.150278 | 466 | 18.5 | 16.82 | 1.68 | 142.04 | |
Eagle Rock Rsvr Precip | 40 | 34.145556 | -118.19 | 1,085.00 | 16.34 | 18.14 | -1.8 | 330.71 | |
Eaton Wash Precip | 41 | 34.074722 | -118.054722 | 261 | 16.26 | 12.4 | 3.86 | 79.55 | |
Flintridge Precip | 38 | 34.181667 | -118.185556 | 1,600.00 | 23.03 | 22.09 | 0.94 | 487.68 | |
LA 96th & Cen. Precip | 36 | 33.948889 | -118.254444 | 121 | 12.99 | 13.78 | -0.79 | 36.88 | |
LA Ducommun St Precip | 37 | 34.0525 | -118.236667 | 306 | 13.54 | 15.63 | -2.09 | 93.27 | |
La Mirada Precip | 28 | 33.883056 | -118.016667 | 75 | 9.33 | 13.45 | -4.12 | 22.86 | |
La Rvr @ Wardlow Precip | 29 | 33.819722 | -118.122 | 25 | 11.3 | 9.9 | 1.4 | 7.62 | |
La Tuna DB Precip | 30 | 34.236667 | -118.326667 | 1,160.00 | 12.52 | 16.44 | -3.92 | 353.57 | |
Lancaster Roper Precip | 31 | 34.679722 | -118.010278 | 2,400.00 | 7.24 | 5.34 | 1.9 | 731.52 | |
Lancaster Waterworks | 3 | 34.801111 | -118.559722 | 2910 | 7.24 | 5.34 | 1.9 | 886.97 | |
Le Habra Heights | 11 | 33.960833 | -117.950556 | 755 | 15.98 | 15.85 | 0.13 | 230.12 | |
Lechuza Pat Sta Precip | 32 | 34.076944 | -118.879444 | 1,620.00 | 21.85 | 22.4 | -0.55 | 493.78 | |
Lewis Ranch Precip | 33 | 34.42 | -117.886389 | 4,615.00 | 17.17 | 15.21 | 1.96 | 1,406.65 | |
Little Gleason Precip | 34 | 34.378333 | -118.149167 | 5,600.00 | 15.67 | 23.87 | -8.2 | 1,706.88 | |
Little Rock Crk Above Dam Percip | 35 | 34.478056 | -118.023333 | 3,267.00 | 9.8 | 9.16 | 0.64 | 995.78 | |
Loomis Ranch Precip | 27 | 34.348333 | -118.048056 | 4,325.00 | 15.39 | 18.55 | -3.16 | 1,318.26 | |
Mescal Smith Precip | 24 | 34.4675 | -117.711111 | 3,810.00 | 9.29 | 7.8 | 1.49 | 1,161.29 | |
Mint Cyn @ Fitch Precip | 25 | 34.446667 | -118.4275 | 1,652.00 | 9.02 | 9.05 | -0.03 | 503.53 | |
Monte Nido Fire Precip | 26 | 34.077778 | -118.692222 | 600 | 19.65 | 22 | -2.35 | 182.88 | |
Newhall-Sol Precip | 21 | 34.425833 | -118.578333 | 1,243.00 | 13.74 | 17.89 | -4.15 | 378.87 | |
North Lancaster Precip | 22 | 34.761389 | -118.125 | 2,310.00 | 2.68 | 5.19 | -2.51 | 704.09 | |
Northridge- LADPW Precip | 23 | 34.231111 | -118.541111 | 1,117.00 | 12.8 | 15.3 | -2.5 | 340.46 | |
Pacoima Dam Precip | 20 | 34.33 | -118.399444 | 1,950.00 | 17.2 | 19.54 | -2.34 | 594.36 | |
Palmdale Water Dist Precip | 17 | 34.594722 | -118.091944 | 2,595.00 | 7.17 | 6.93 | 0.24 | 790.96 | |
Pine Canyon Patrol Station Pcp | 18 | 34.673333 | -118.429167 | 3,286.00 | 17.24 | 19.14 | -1.9 | 1,001.57 | |
Pnt Vicen Ligh Precip | 19 | 33.741667 | -118.410556 | 125 | 18.87 | 11.07 | 7.8 | 38.10 | |
Pudd Div Precip | 15 | 34.129167 | -117.780833 | 1,130.00 | 20.43 | 19.21 | 1.22 | 344.42 | |
Quartz Hill Precip | 16 | 34.648056 | -118.24 | 2,395.00 | 9.96 | 7.97 | 1.99 | 730.00 | |
Redman Precip | 14 | 34.764444 | -117.925 | 2,360.00 | 5.59 | 5.18 | 0.41 | 719.33 | |
Relay | 2 | 34.735 | -117.776944 | 3057 | 6.52 | 5.15 | 1.37 | 931.77 | |
Rocky Buttes Precip | 13 | 34.65 | -117.863333 | 2,540.00 | 6.57 | 4.84 | 1.73 | 774.19 | |
San Gab Pow House Precip | 12 | 34.155556 | -117.907778 | 744 | 16.16 | 22.98 | -6.82 | 226.77 | |
San Gabriel Dam Precip | 7 | 34.205556 | -117.860556 | 1,481.00 | 28.78 | 28.86 | -0.08 | 451.41 | |
San Gabriel East Fork Percip | 8 | 34.235833 | -117.805 | 1,600.00 | 25.55 | 26.04 | -0.49 | 487.68 | |
Sanberg Airways Station Precip | 9 | 34.746389 | -118.724167 | 3,635.00 | 10.94 | 12.85 | -1.91 | 1,107.95 | |
Santa Anita Dam Precip | 10 | 34.184167 | -118.019722 | 1,400.00 | 27.17 | 26.21 | 0.96 | 426.72 | |
Tanbark Precip | 6 | 34.205278 | -117.760833 | 2,750.00 | 43.66 | 28.04 | 15.62 | 838.20 | |
Topanga Canyon Patrol Station Pcp | 5 | 34.084167 | -118.599167 | 745 | 18.89 | 24.42 | -5.53 | 227.08 |
Monday, February 21, 2011
Fire Hazard Risk Map - Week 7 - Spatial Analysis II
First, It has been collected three DEMs from the Seamless Server Dataset covering 34N117W; 34N118W and 33N118W. Have been unified into one single Raster Elevation Dataset as ESRI GRID.
The second step has been the calculation of relative slopes across the whole area.
The slopes of elevation have been calculated with the percentage mode, and divided into 9 significative ranges that represent strong differences in fires and gases behaves:
3%-6%-12%-20%-50%-85%-150%-300%
The average augment between one range and the following has been divided into 66% (four cases) and 100% augment (four cases) from the previous range.
This in order to distribute an exponential level of change within every class.
These ranges have then been reclassified considering the exponential range values into ten new classes, which combined for the from level 1 to level 8. This scale identify the advantage gained by fire in these areas, considering that steepness is a factor able to increase fires' power and speed, and that warmer gases tend to move in upper elevations of the atmosphere.
This values will weigh up to 8 points or 22.2% into the final hazard scale for the Station Fire Area, which has a total of 36.
The zone where Station Fire sprawled two years ago is an area of high elevation and steepness, which present no rivers or water land, differently form other areas in LA county.
(see map 1)
A second factor for the identification of Fire hazard risk factor has been the land coverage.
Using the scale produced by researchers from Greece (see Ref. 1), who determined risk indices for Mediterranean forest species based on flammability properties of Vegetation, and the Land Cover data from USGS Earth Explorer of Los Angeles County, the different coverages have been grouped into a classification scale with factors ranging from 0 to 25,
which will be added later to the original 1-8 scale for Slopes using Raster Calculation.
Also the presence of water in nearby areas has been taken into account for two reasons:
- First, wetlands act as natural obstacles to fire, and delimitate the sprawl with benefice consequences for the areas close to them.
- Second, in case of Firemen intervent, the availability of water ready to use to fight against fire in crucial areas not always reachable by airplanes and helicopters or when those are used in other zones, is an important factor.
Areas of Station Fire zone have been divided into four ranges corresponding to buffers of 5, 10, 15 and 20 kilometers from an available resource of natural water, from 1 to 4.
The fourth and last factor is the distance from available roads. Roads may act as cut fires,
can facilitate detailed intervents into particular areas, which otherwise necessitate the action of Canadair planes and helicopters. To this factor have been given values of risk augment from 0 (within 200 meters from an existing road) to 3 (more than 2 kilometers from an existing road).
Raster data Calculator allows analysts to weigh every factor easily, according to what other specific experts say regarding particular factors, such as the fuel potential of vegetation or the behave of fire with steepness factor.
The final map is the final result of these four different factors into a weighed, comprehensive map of risk.
The Station Fire occurred into an area matching with these factors, as is it possible to see in the last map. Many Red Squares are within its boundaries. Probably also factors of climate and predominant winds had an active role in determining the shape of the involved area. Cells with different color legend are missing one or more of the factors of calculation, for example are outside the buffer calculated for roads of wetlands, or still missing Land Coverage data or Slope of Elevation.
It is included again the road and wetland layers in order to show a geographic reference.
MAP 1: Rivers and Wetlands within Station Fire Extent.
MAP 2: Creating a Fire Risk Grid
MAP 3:
1) Determining hazard risk indices for Mediterranean forest species based on particle flammability properties
S. Liodakis, a, , I.P. Agiovlasitisa, T. Kakardakisa, N. Tzamtzisa, D. Vorisisa and E. Loisa
a Department of Chemical Engineering, National Technical University of Athens (NTUA), 9 Iroon Polytechniou Street, Athens 157 80, Greece
Received 9 February 2010; revised 20 June 2010; accepted 23 November 2010. Available online 24 December 2010.
Tuesday, February 15, 2011
Suitability Analysis - Week 6
DISCUSSION
As shown in the above maps, spatial analysis of complex problems such as finding the best place for several activities has never been so facilitated by technology.
A GIS can perfom several kind of analysis in a separate and/or combined manner. It is possible, for example, to quantify and apply particular buffering zones to the most important environmental resources such as forests, biospheres in danger, or simply protect wetlands from pollution. The wide range of personalized tools it is possible to apply, in fact, are able to satisfy almost an infinite number of spatial requirements such as the preferred buffer zones from a particular animal habitat or river. Thanks to the different formats of datasets: Vector, Raster and database, it is possible to visualize, measure, store and work on any typology of information needed by the analysis process.
In the case above, several variables have been considered in order to find the suitable locations for the construction of a new landfill in the territory of a county:
This makes GIS an irreplaceable tool for Urban and Regional Planning, and should be always considered when performing complex spatial analysis, also because it may reveal patterns or relationships hidden at the bare human eye.
As an example of its powerful analysis capability, it has been recently put focus on the case of the expansion of a landfill in California's Central Valley: some people died and others had serious health trouble and birth defects for the contamination of the Drinking water system of Kettleman, a city in the Central valley which has high levels of agricultural and farming activities. the Element responsible for the deaths apparently is the Arsenic, highly used in pesticides, herbicides and metal alloys. A Landfill is currently located 3.2 miles south of the city, and until present times it has been used as waste disposal area for Mothball and other dangerous elements. It is likely that the Waste Management company built that facility in times when only surface features such as elevation were taken into account when deciding the suitable location.
There are many factors involved into the spread of polluting substances into environment and their interrelation with human activities. The reasons of this fatality may have been related with a wrong spatial analysis, which took into account exclusively the presence of people in the immediate nearby of the waste facility. In reality, the factors and the risks are several and different, and also have different weight in terms of importance. The presence of wetlands of subterranean rivers and the porosity of the soil are factors that can extend enormously the area of risk, and in a way which is not uniform but has influences from the slopes and the elevation of the area, or even the amount of rain within the site.
Only a well planned GIS analysis can take into account all these factors and establish a proper mathematical formula and model that takes into account all the known variables.
The Department of Toxic Substances, having the power to establish State or Nation level Guidelines and provide experts for GIS analysis, should establish a process of deep investigation to be addressed before every new waste management plant or landfill is created.
Using all the possible and known factors, including but not limited to:
- Soil permeability/drainage
- Distance from Wetlands and their eventually connected river system network;
- Land typology Coverage with qualitative differences between the surfaces involved;
- Elevation;
- Slopes of elevation;
- Distance from human settlements and activities including land used for farming, agriculture, ect.
would be possible to establish a standard GIS model and procedure that can be applied to all the locations nationwide or Statewide when deciding the suitable location for a waste treatment zone or landfill area.
The second most important advantage is that with GIS, using the Raster Calculator and the Reclassification tools, it is possible to change the importance of each singular factor to a scale that fits well the reality and the game of factors involved.
Examples of bad environmental management such as Kettleman City could be in this way avoided in future and the whole general procedures generally enhanced for a better and qualitative service to citizens.
Giuseppe Riccardo Belvisi
Wednesday, February 2, 2011
Buffering Marijuana dispensers - Exam
Dear LA City Council, I would like to express my agreement with the idea about the institution of the 1,000 feet buffer law from the marijuana dispensers.
I thought the idea was very unlikely to be realized because of the limites space in the urban tissue, but considering four kinds of locations:
- Schools;
- Churches;
- Recreation areas;
- Public Libraries;
- Public Parks;
Only 3 of these public facilities and institutions resulted within the 500 feet boundaries,
While more than 22 of these resulted in the requested 1,000 feet buffer, as you can see in the selection.
The reason is that I think as a Geographer that such an objective is practically impossible to realize. The buffers of all the locations involved, such as public libraries, schools, recreation centers.
I would rather suggest to transform the buffer into a 500 feet buffer zone from all those five locations. In this way the changes for retailers should be acceptable, rather than changing locations for all the 5 typologies of locations and the retailers/dispensers themselves
Monday, January 31, 2011
Tuesday, January 25, 2011
WEEK 3 - THE GEOCODING EXERCISE
users can create list of features and things by their own also of items and tendencies that other people never mapped and addressed before. This is extremely important when analyzing fields of studies never studied before, because locations are usually not organized in databases such as googlemaps or other public websites.
Geocoding function of Arcgis is a basiliar tool of neogeography as well as for enterprises or research individuals and institutes, who are able in this way to keep a geolocated list of objects, from customers to animal species.
In this representation, the study has been focused, as an example, to the distribution of Public Libraries within the West Los Angeles area and next to UCLA campus. With a Geocoding process, the addresses have been added to a Geodatabase and then displayed into a map layer that shows all the streets and freeways of Los Angeles County.
A very useful tool has been the buffering tool of Arc Tool Box, which has been employed in the Multiple Ring version in order to show distances within 250, 500 and 1,000 meters from the Libraries' location. Maps like this, could be very useful for students or library users who live in the area and have to decide where to go considering factors such as the opening times, or at the moment of deciding the location of your new personal room.
Finally, the Annotation and the transparency functions have been used to do not create confusion and unconformity by leaving a 40% transparency to the buffer rings' colors and showing the name of the displayed library only in scales larger than 1:60,000, as it is possible to see in the maps.
NAME, ADDRESS
Brentwood Branch Library ,"11820 San Vicente Boulevard, Los Angeles, CA "
Blumentha l Library ,"10400 Wilshire Boulevard, Los Angeles, CA "
Santa Monica Public Library ,"601 Santa Monica Boulevard, Santa Monica, CA "
UCLA Law Library ,"385 Charles E. Young, Los Angeles, CA "
Archive of Popular American Music ,"1102 Schoenberg Hall, Los Angeles, CA "
Getty Center ,"1200 Getty Center Drive, Los Angeles, CA "
West Los Angeles Regional Library ,"11360 Santa Monica Boulevard, Los Angeles, CA "
Rosenfeld Library ,"110 Westwood Plaza, Los Angeles, CA "
Los Angeles City Library ,"2920 Overland Avenue, Los Angeles, CA "
West Hollywoo d Public Library ,"715 North San Vicente Boulevard, Los Angeles, CA "
UCLA Instruction al Media ,"46 Powell building, Los Angeles, CA "
Simon Wiesentha l Center ,1399 Roxbury Drive
Margaret Herrick Library ,"333 S La Cienega Boulevard, Beverly Hills, CA "
Santa Monica College Library ,"1900 Pico Boulevard, Santa Monica, CA "
Barrister Research Library ,"1801 Century Park E 2500, Los Angeles, CA "
Montana Avenue Library ,"1704 Montana Avenue, Santa Monica, CA "
Southern Regional Library ,"305 De Neve Drive, Los Angeles, CA "
LA County Law Library ,"93355 Burton Way, Beverly Hills, CA "
Robertson Library ,"1719 South Robertson Boulevard, Los Angeles, CA "
Mar Vista Branch Library ,"12006 Venice Boulevard, Los Angeles, CA "
Jewish Communit y Library ,"6505 Wilshire Boulevard, Los Angeles, CA "
Cedars-Sin ai Medical Center Library ,"444 S San Vicente Boulevard, Los Angeles, CA "
Geology & Geophysic s Collection ,"4697 Geology Boulevard, Los Angeles, CA "
St John's Hospital Library ,"1328 22nd Street, Santa Monica, CA "
TDI Library Services ,"11340 W Olympic Boulevard, Los Angeles, CA "
Beverly Hills City Library ,"444 North Rexford Drive, Beverly Hills, CA "
Cook's Library ,"8373 West 3rd Street, Los Angeles, CA "
Seletracks Library ,"10327 Santa Monica Boulevard, Los Angeles, CA "
Goether Institute Los Angeles ,"5750 Wilshire Boulevard, Los Angeles, CA "
Mayme Clayton Library ,"4130 Overland Avenue, Culver City, CA "
LA84 Foundatio n Library ,"2141 West Adams Boulevard, Los Angeles, CA "
Walt Disney Co. Library ,"500 South Buena Vista Street, Burbank, CA "
Abbot Kinney Memorial Branch Library ,"501 South Venice Boulevard, Venice, CA "
Rand Library ,"1776 Main Street, Santa Monica, CA "
Dick Clark Movies Library ,"2900 Olympic Boulevard, Santa Monica, CA "
The Film and Music Company Library ,"12233 Olympic Boulevard, Santa Monica, CA "
Buena Vista Library ,"300 North Buena Vista Street, Burbank, CA "
Memorial Branch Library ,"4625 West Olympic Boulevard, Los Angeles, CA "
Pio Pico Library ,"694 South Oxford Avenue, Los Angeles, CA "
Gonda Family Library ,"330 Charles E Young Drive North, Los Angeles, CA "
Fairview Branch Library ,"2101 Ocean Park Boulevard, Santa Monica, CA "
Wilshire Library ,"149 North Saint Andrews Place, Los Angeles, CA "
Autry National Center ,"4700 Western Heritage Way, Los Angeles, CA "
Edward L Doheny Memorial Library ,"3550 Trousdale Parkway, Los Angeles, CA "
Palms Recreation Center ,"2950 Overland Avenue, Los Angeles, CA "
UCLA Film & TV Archive ,"1015 North Cahuenga Boulevard, Los Angeles, CA "
Firstcom Music Library ,"9255 W Sunset Boulevard, Los Angeles, CA "
North Hollywoo d Regional Branch Library ,"5211 Tujunga Avenue, San Fernando Valley, CA "
Marina del Rey Library ,"4533 Admiralty Way, Marina del Rey, CA "
ESRI Geocoding Tutorial - Page 19