MAPPING RACES DISTRIBUTION IN THE US
1 - Presence of White Population within US Counties
1 - Presence of White Population within US Counties

White people are the predominant race in the US for both average percentage upon total within the Counties, total population and Homogeneity of distribution. As showed by the above map in blue color tones, Whites have a high share of population on almost every county, except some sparse, isolated group of counties within Continental US and Alaska. White Race populated every single county of the Nation, growing in number in every climate conditions.
Despite this huge diffusion gained in several centuries of occupation, white race still prefers temperate/cold temperate climates, even if basically the difference in percentage is due to the fact that other races of the US only live in certain areas, while whites have an equal absolute distribution in term of number. This means that while Whites have been able to sprawl and grow everywhere, other races, for political, colonialism and anthropological reasons, settled or grow only on certain areas of the Nation.
This however does not apply to biggest and then most globalized cities such as Los Angeles, New York, Dallas or many others, where the distribution and share cake of every race is more equal.
Overall, at the year 2000, whites were the 75% of the total population with 211.6 millions individuals and had a Mean Average per county of 84.4% of the share.
2 - Presence of Afro-american Population within US Counties

Figure/Map two shows the distribution of Afro-americans within the US Counties. This is certainly the data showing the strongest geographical trend. Literally, south-east counties are those where Blacks have been relegated to live and work after coming from African coasts during colonialism times. In certain counties counties of Alabama, Louisiana and Georgia, Blacks are more than 2/3 of total population. Overall, the percentage of total population at the year 2000 was only 12.32% for them, with a Mean per County of 8.9%, 9.5 less time than Whites compared with a 6.5 less total population. This is because in many northern and central states and counties blacks are often less than 1% of the population share. Again, in biggest cities the number tends to be closed to the actual absolute value for the US overall.
3 - Presence of Asian-american Population within US Counties
 The Map in Figure 3 let us understanding the distribution and dynamics of Asian growth and sprawl towards the US. The Red an Orange cells represent Counties with higher Asian population.
As it is possible to see, Western coastal counties and biggest cities of the rest of the Nation have higher Asian population share.
As with Black Americans, Asian population distribution has to do with historical dynamics of the US. Asians came into america in the second half of XIX century, at the time of Gold rush in Western States. Since then, the resident population resided in those counties and grow until today's rates of about 10-50%. Also, additional migrants came during the last 100 years and brought the total population of Asians to be the third race in all the US at over 10 million individuals in year 2000.
Also, the biggest effect of this dynamic is that they are very concentrated into Californian, Washington, Arizona and Nevada's States in the West, and other main cities in the Eastern states. Asians tend to sprawl and grow today in places more interconnected into the global network, as it is possible to see from the map. They are a relevant percentage in main cities and coastal areas of the US, and very well connected with areas connected to the global business network such as New York, Dallas or San Francisco.
4 - Presence of Native american Population within US Counties
 Map 4 reflects a main event in North American History: Native Americans disappearance. Natives were more than 90% of population before XIX century, completely integrated into its ecosystem and overall less than 5 millions before the arrival of Europeans. After the contact of the two civilizations, Natives have been relegated into areas with less percentage of Whites. Whites and Natives have been basically in fight for many decades during the last centuries, resulting in a relegation of Native Americans toward mid-west states and counties of the US, where Indian Reserves and natural habitats are more conserved and White race less present. Natives in 2000 were less than 2.5 millions inhabitants on a total population of more than 281 millions, which means a 0.85% overall. Also, even in the counties where they are a large share of population, they NEVER reach the 50.0% percent of county's share, stuck at 47.7% in one county of Arizona. As an average, they are very diffused in Mid-West counties with a Mean of 1.9%. They are definitely the less present population in the US between all those studied.
3 - Presence of Other Races Population within US Counties
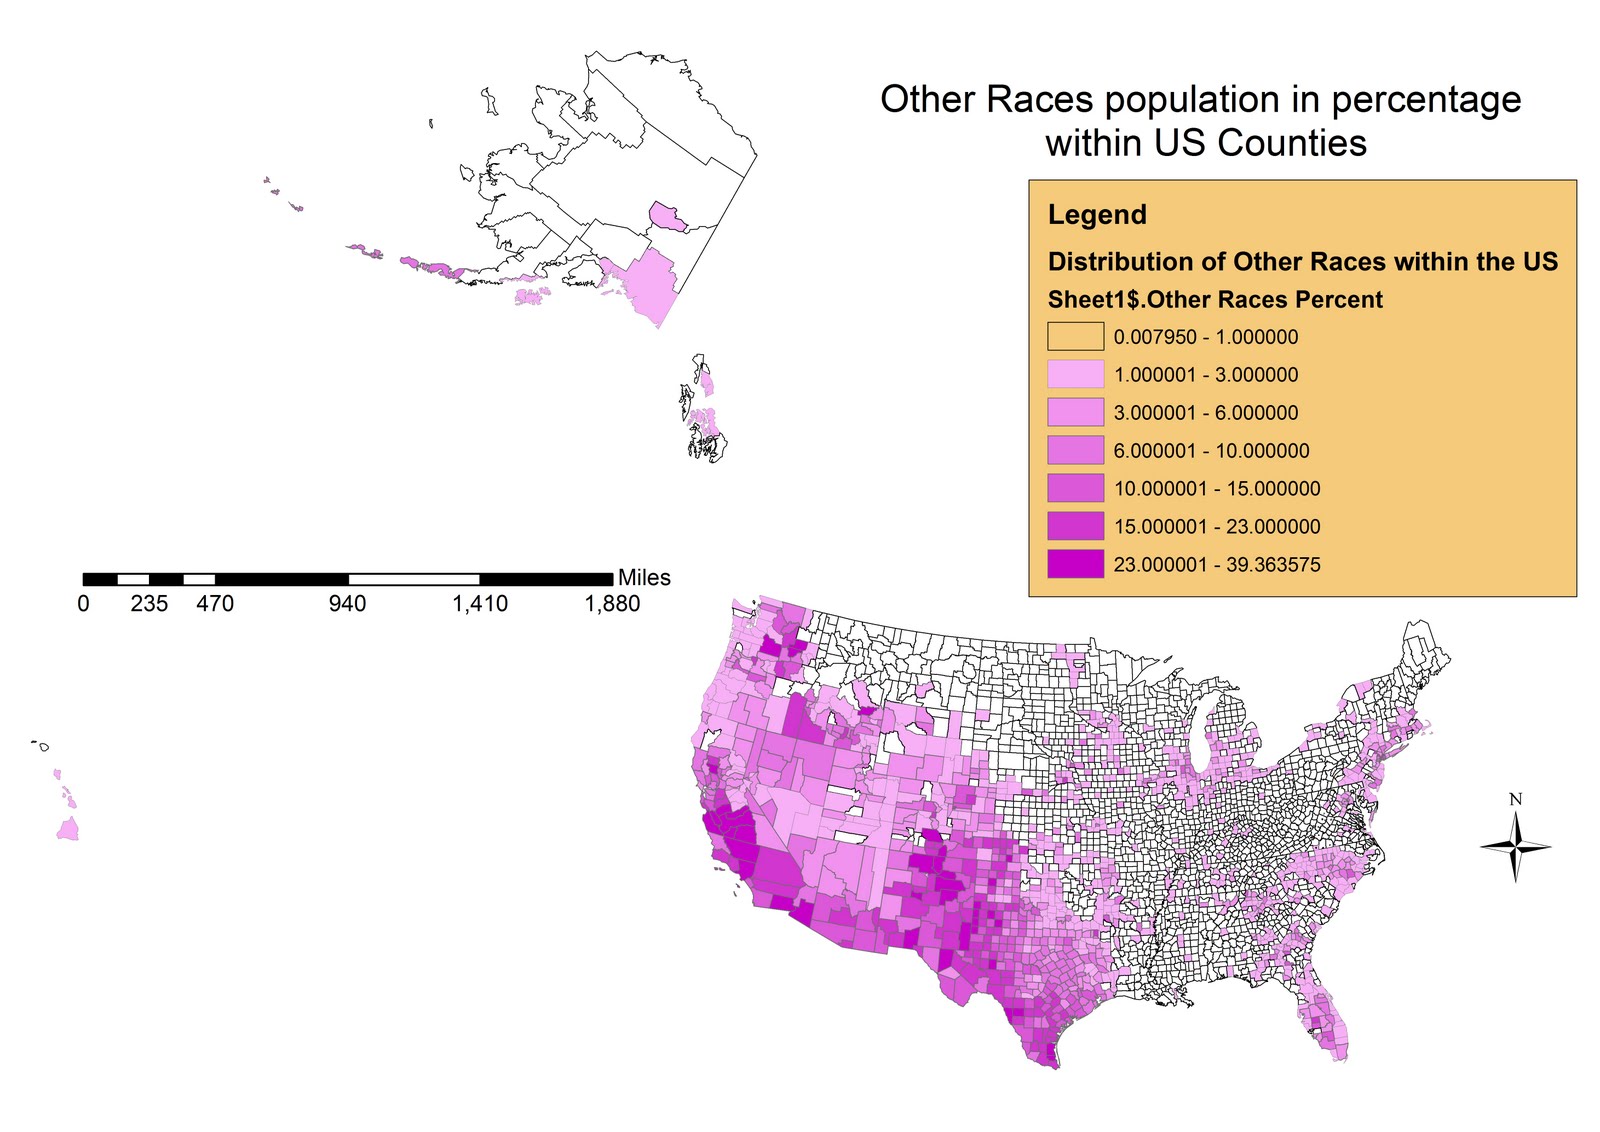
The last map (5th), identifies the presence of other races within the US Counties.
Normally this Census Category represents immigrants who came into the US from Latino-american and Carribbean countries. In fact, they are located mostly into South-Western states that are closer to the borders of countries such as Mexico which are the biggest origin countries for the highest percentage of US immigrants today. Southern California is one of the biggest receivers for individuals incoming from Mexico or Central America who represent the most recent ethnicity in the US immigration history. Despite their recent times, they are already the 15.58% of overall population in the US and 2.6% on every county as an average (mean). Also in this case, with the exception of Carribbean and Hispanic majority Counties, they never reach more than 1/3 of total local population, a character that identify their recent migration.
THE IMPORTANCE OF GIS
GIS are THE new, revolutionary tool of our IT generation. If we think at what changed during the last 10 or 5 years on this sector, we can see both how much this was useful and how much this is going to make the difference on our societies.
The wide range of applicability of these software, which we experienced during the lab sessions, has been very interesting and for sure is a factor of motivation when learning GIS.
Overall, the course was a very good introduction, with both technical and theoretical foundations on the discipline, and allowed us to learn gis tools with the motivation given by the facts that we analyzed during the course itself, such as wildfires, buffering areas of airports, etc.
I liked the approach we followed and for sure I am going to continue on learning GIS